Features / Run the line & cut scrap

05 OEE & loss analysis

Turn OEE into the scrap, idle time, and energy losses you can actually cut.

acqSYS calculates OEE (overall equipment effectiveness) from the workflow itself and shows where the losses come from: preparation-aware availability, downtime events, target vs actual speed, graded spool outcomes, and energy consumption from the connected telemetry — so the number points at scrap, idle time, and energy you can act on.

Use the demo to compare OEE from a job, a line, and a production report.
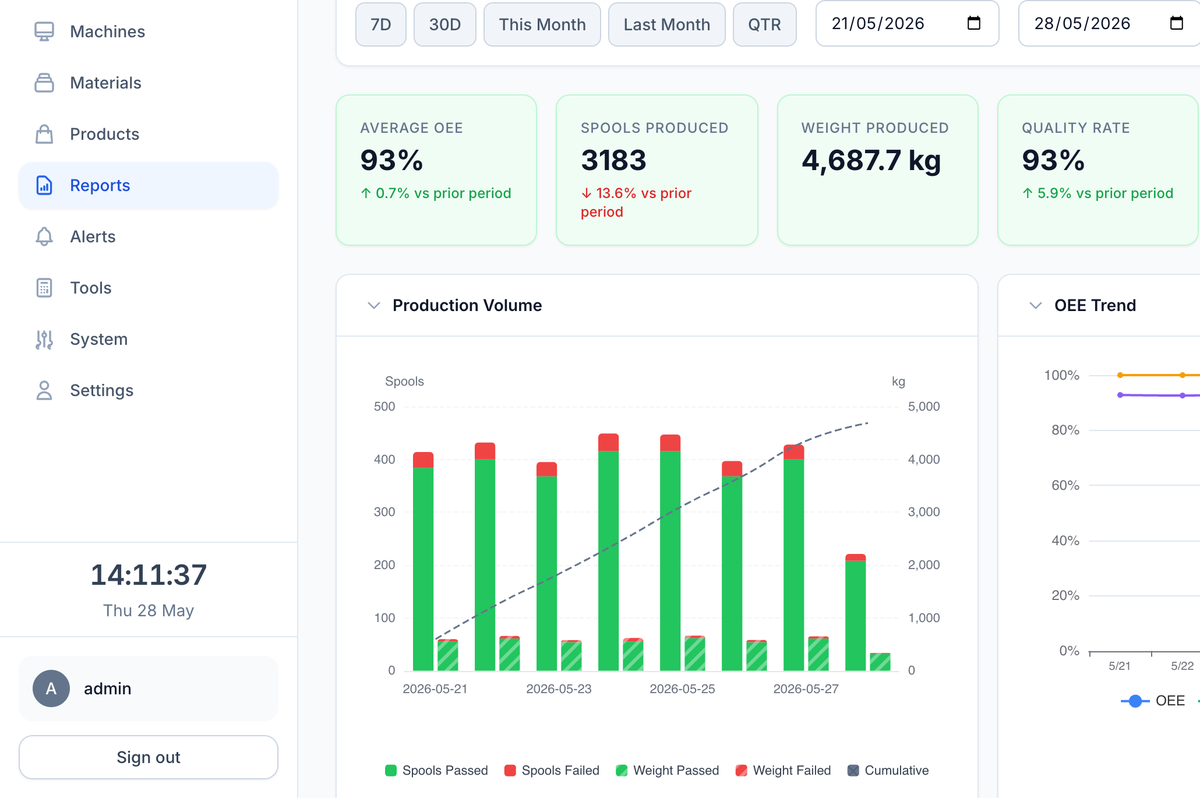
The production report: date presets, headline KPI tiles, and production volume and OEE trend charts.
Avg OEE · 93% · quality 93%
Production report KPI tiles: average OEE 93%, spools produced 3183, weight produced 4,687.7 kg, and quality rate 93%.
Primary user

Manager + supervisor + technologist

The team turning OEE into coaching, process review, and improvement rather than a spreadsheet debate.

Key boundary

Insufficient data stays visible

Missing target speed, density, diameter, or spool speed data never becomes a fake zero.

See it in the demo

Prep-heavy job

Open a prep-heavy job and see setup time excluded from availability instead of dragging the number down.

What you get

Every OEE component comes from production evidence you can inspect.

Preparation-aware availability, speed-based performance, and quality from graded spools — with missing data flagged instead of hidden.

Availability

Preparation separated

Preparation is separated from production time so setup does not distort run-time truth.

Performance

Speed-based method

The speed-based method compares actual average speed with target speed and shows above-target running.

Quality

Three-tier spool result

Quality is the share of passed spools among all graded spools — passed, length fault, or diameter fault — not a vague good/bad counter.

The moment

OEE loses trust when setup, speed, downtime, and scrap are mixed together.

Filament OEE is easy to argue with and hard to act on when setup, scrap, and speed are each counted a little differently by whoever reports them.

Before Factory moment

  • Preparation output, transition spools, and missing target speed are handled inconsistently.
  • Downtime, failed spools, and over-target speed distort the headline number.
  • The number becomes political instead of useful for management or engineering.

With acqSYS What changes

  • The Preparation phase separates setup from confirmed production.
  • Transition runs are excluded from OEE, so changeover output never poisons the number.
  • Performance compares actual average speed with target speed — when no target is configured, one is calculated from the product's density and diameter.
  • Final OEE is stored on the job and reused by operator history, dashboards, and reports.
01 — Workflow

An OEE number your managers and technologists stop arguing about.

More than a headline number — the calculation shows what made it believable, incomplete, or worth engineering review.
  • Start clean. Open the job in preparation and confirm production only when spool tracking should begin.
  • Record reality. Capture downtime events, speed/length data, target speed, energy consumption, and produced spool outcomes.
  • Calculate components. Availability, performance, quality, and OEE are computed with missing requirements exposed.
  • Review trends. Use job, line, operator, and product reports to separate resource, person, product, and downtime drivers.
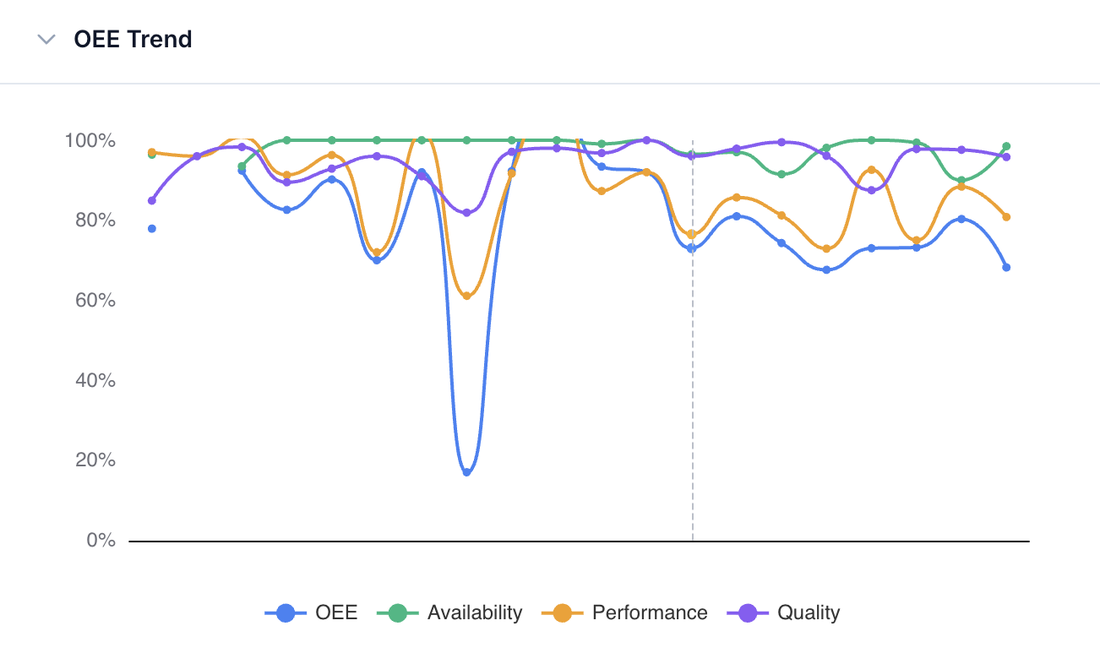
Loss event · OEE below 20%
OEE trend with a real loss event: OEE dips below 20% while availability, performance, and quality show where the loss came from.
02 — Production context

Setup, downtime, and scrap separated — so the number means something.

OEE is useful only when the system understands preparation, downtime, target speed, output, and quality outcomes.

  • Component truth. Availability excludes preparation from production time; performance shows above-target speed instead of capping at 100%; quality uses passed, length-fault, and diameter-fault spool outcomes.
  • Data requirements. Target speed comes from haul-off settings — or is calculated from the product's density and diameter when none is set; spool speed and length data give the actual average speed.
  • Management value. Fewer weekly definition debates; clearer coaching by line, operator, and product; better prioritization across downtime, quality, speed, and energy losses.
Scope & advantage

An OEE wired to jobs, spools, downtime, and QC — not a standalone calculator.

Honest scope OEE should show what it cannot know.

  • When speed data, target speed, density, diameter, or spool evidence is missing, acqSYS surfaces the missing requirement instead of forcing a misleading value.

acqSYS advantage Every component traces to spool, downtime, and operator evidence.

  • OEE is connected to the job lifecycle, preparation phase, downtime events, ProductHub, spool speed/length, QC scheme, operator dashboard, and reports.
Connected features

OEE draws on the record the whole workflow writes.

See OEE & loss analysis in action

Make your OEE definition operational.

We will turn your preparation rules, downtime reasons, target speeds, and QC outcomes into an OEE definition your managers and technologists can defend.