acqSYS turns the work inside a filament plant into one connected record — from incoming demand and AI-assisted planning through operator work, live process data, and spool QC to labels, fulfillment, and formulation learning.
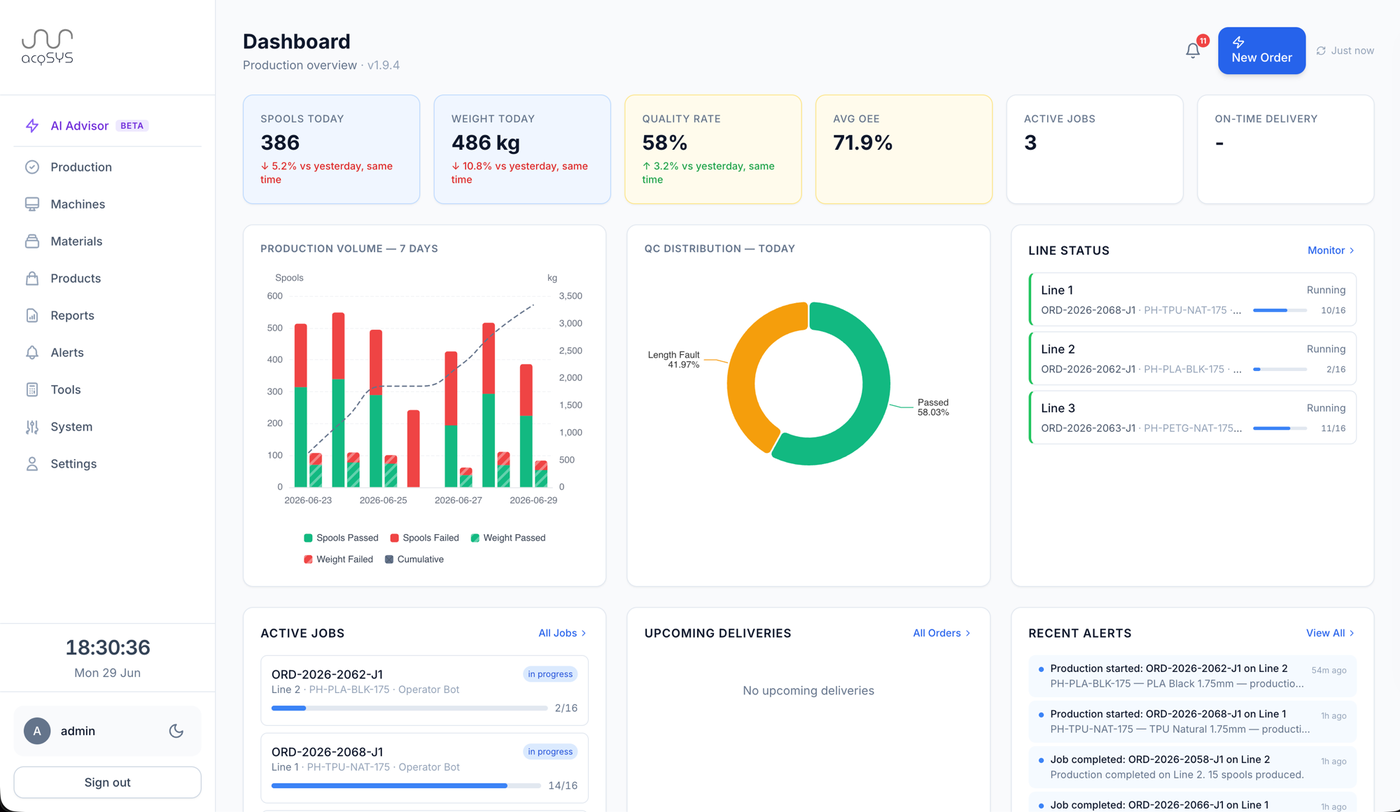

Most bottlenecks appear when an order becomes line work, a setup becomes measured behavior, a product trial becomes repeatable knowledge, a spool becomes a quality record, or finished output becomes stock. acqSYS is designed around those filament-specific connections.
Every capability supports one of four conversations: control and plan the floor, run the line, prove every spool, and connect systems to learn and improve the product.
01 Control & plan the floor
Give planners one queue for demand from manual entry, spreadsheets, sales, e-commerce, or ERP. Priority, remaining quantity, product readiness, and batching opportunities stay visible before work reaches the line.
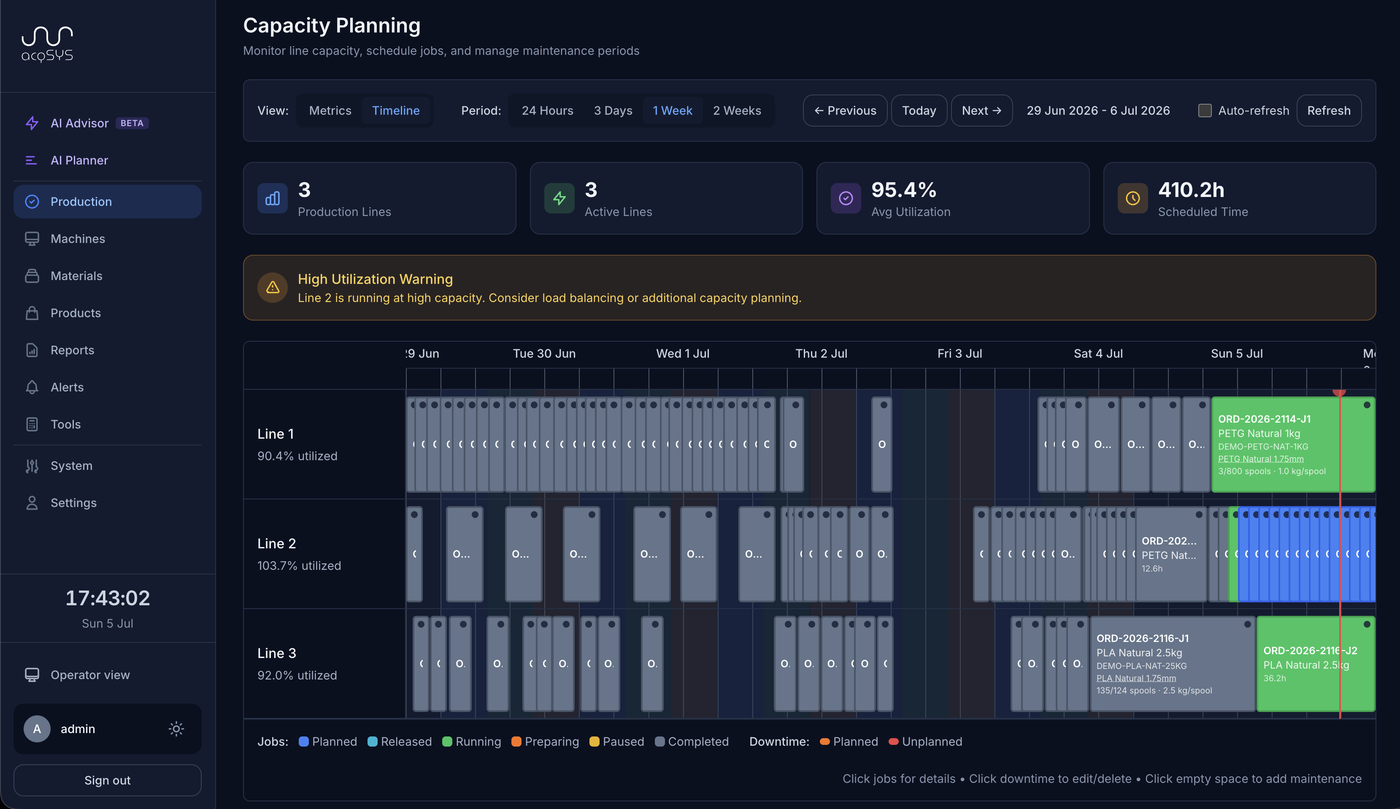
Planning →Turn backlog into scheduled jobs with shift context, line configuration, capacity pressure, and duration estimates. The AI Production Planning Agent generates optimized, editable scenarios before accepted plans commit through scheduler validation.
Planning →02 Run the line
Operators see the assigned job, setup, targets, spool progress, and comments; supervisors release, pause, resume, hand over, and take over with responsibility recorded in the job history.
Monitoring →ProductHub keeps formulation, process settings, SKU identity, packaging, EAN, labels, QC scheme, and compatible line setup together so the same knowledge feeds planning, operators, labels, reports, and R&D review.
Product model →03 Prove every spool
Each spool receives a three-tier quality result with measurement context, Cpk where available, length evidence, and raw-material LOT traceability tied back to the exact job, recipe, process window, and production period.
Quality →Start from a spool and reach the order, job, line, operator, setup, recipe, QC, label, and production time. Investigation starts from the physical unit the customer received.
Traceability →Use visual templates with ProductHub, SKU, spool, QC, QR, and barcode variables. Labels are printed from the connected spool record, reducing retyping between QC and packaging.
Labels →04 Connect, learn & improve
Review output, quality, line utilization, operator activity, product behavior, process stability, downtime, and trends. Preparation and transition runs are kept separate so OEE is useful instead of decorative.
Reports →Route line-state changes, quality patterns, missed targets, delays, comments, overdue work, and shift summaries to the people who can act, with the connected record one click away.
Alerts →Bring external demand and line telemetry into acqSYS without bypassing production review. Inventory and fulfillment updates return only after confirmed output.
Integrations →AI Process Advisor beta reads spool, QC, and telemetry evidence so technologists can review quality-risk signals and validate formulation or setpoint changes against measured outcomes — decision support today, autonomy on the roadmap.
AI Process Advisor →The record is shared; the questions are different. Owners need direction, planners need workable demand, supervisors need exceptions, technologists need process context and trial evidence, QC needs proof, and operators need the next safe action.
Set measurable KPIs across roles and teams, track progress from operating and process data, and settle performance conversations against agreed targets rather than anecdotes.
Use backlog, scheduling, AI planning scenarios, capacity, priorities, shifts, and fulfillment confirmation to keep work moving without duplicate spreadsheets.
Use line monitoring, job assignment, handovers, downtime reasons, alerts, and comments to manage the shift as it happens.
Use formulations, process settings, machine configurations, historical process data, QC outcomes, and AI Process Advisor beta signals to optimize products, support R&D, and deliver the right knowledge to the line.
Use spool QC, Cpk, quality patterns, traceability, product reports, and public verification configuration to control quality and investigate issues.
Use the operator dashboard to see the correct job, recipe, setup, shift context, target parameters, spool progress, instructions, comments, and next action — with a multilingual interface for shop-floor teams.
acqSYS keeps these distinctions visible because they change planning, QC, fulfillment, reporting, and customer trust.
The production and engineering team uses acqSYS from shop-floor tablets, office workstations, laptops, and management devices. The meaningful work is in configuration: lines, shifts, roles, products, process targets, QC schemes, labels, machine signals, and system connections.

What mattered to 3D-Fuel was connecting the practical pieces of daily production work: planning, operator workflow, QC records, spool-level traceability, process history, and management visibility in one operating layer.
One of the most visible changes for 3D-Fuel was production planning. Instead of coordinating work mainly through spreadsheets, the team gained a more visual way to understand what is scheduled, what is running, what operators are currently working on, and what can be transitioned next.
Read the 3D-Fuel story →Diameter readings give a clear go/no-go for every spool — even for a new hire — and when a fault appears, the team grabs the spool ID and traces what happened instead of speculating.
Historical process data can be linked to product context, QC outcomes, and spool/job history, providing a stronger basis for process review and future R&D work.
Use the demo to follow that question through acqSYS: demand into AI-assisted planning, setup into operator work, process data into QC, or spool proof into labels and fulfillment.