Features / Plan & optimize

01 Production command center

Start each production day from one live floor picture.

acqSYS gives owners, plant managers, supervisors, and technologists a single operating view of what is running, what is stuck, what is drifting, what is at risk, and where to drill next.

Use the demo to replace a status-collection meeting with a live floor review.
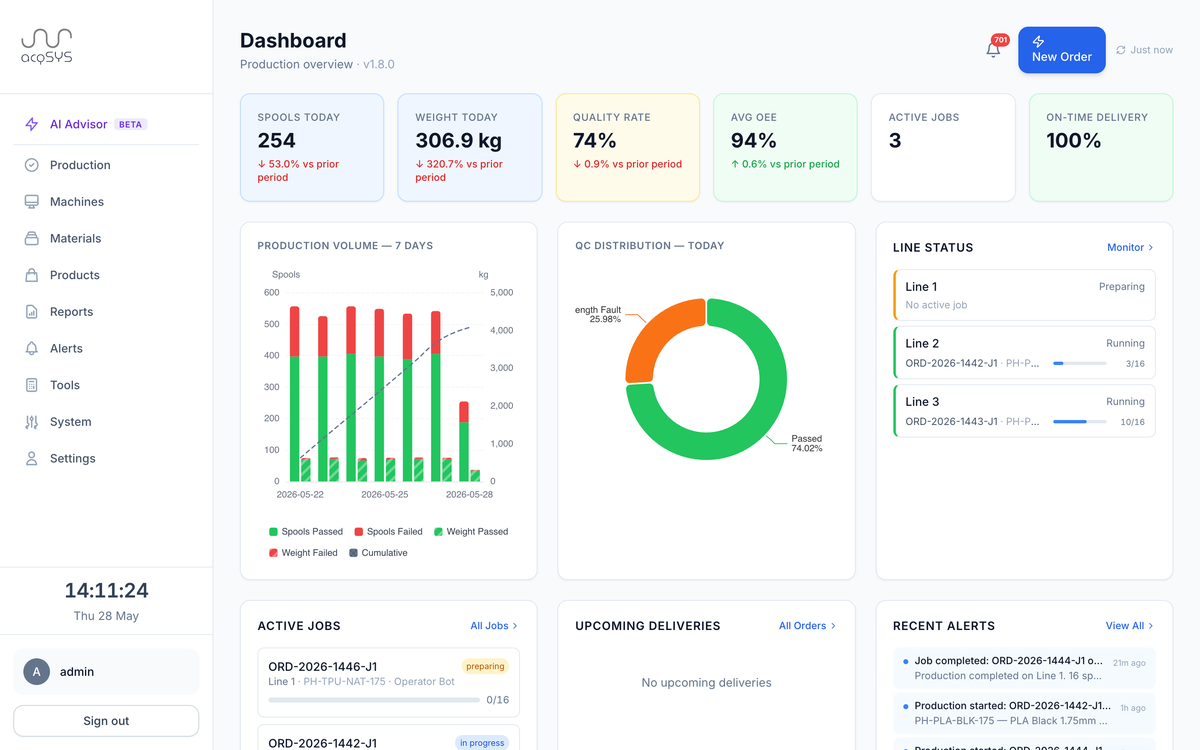
The acqSYS command center dashboard: headline numbers, production volume, QC distribution, line status, active jobs, and alerts.
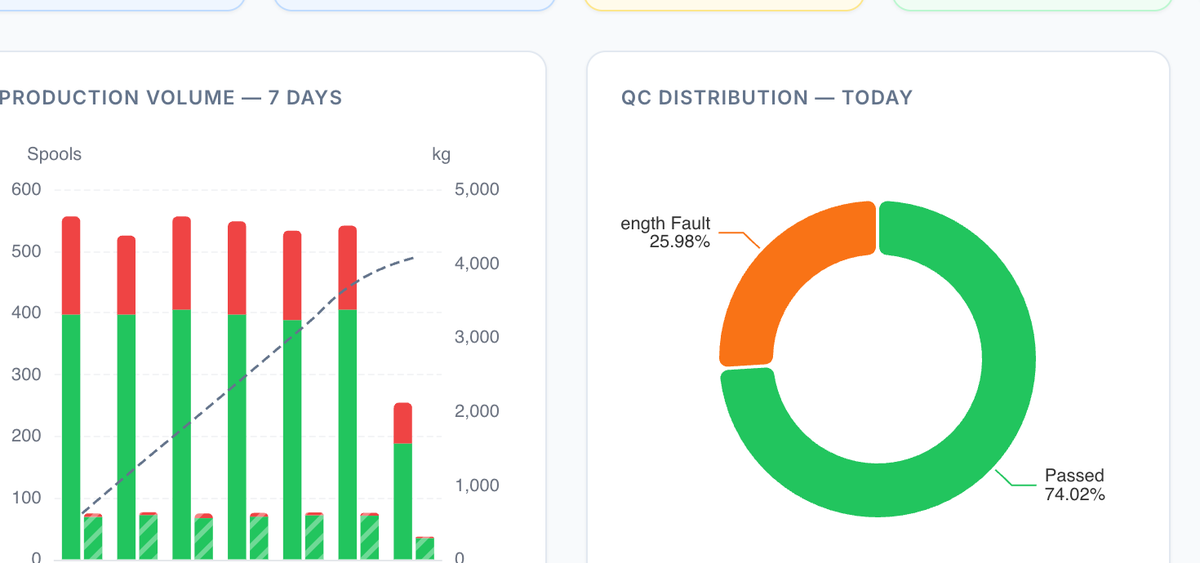
QC today · 74.02% passed
Seven-day production volume beside today's QC distribution: 74.02% passed.
What you get

One live view of lines, jobs, quality, and delivery risk.

Line state, active jobs, spool output, QC split, OEE, alerts, and delivery pressure on one screen — the picture your morning meeting used to spend twenty minutes rebuilding.

Primary user

Operations + process lead

Owners, plant managers, supervisors, and technologists who need decisions before the next walkaround.

Core record

Order → job → spool → process

The dashboard reads the same record updated by operators, QC, planning, monitoring, and fulfillment.

Best demo

Morning standup

Compare the current daily meeting with the live acqSYS command-center flow.

Floor state

What is running

Line status, active jobs, operators, progress, and recently produced spools.

Risk view

Risk, before the walkaround

QC distribution, open alerts, upcoming deliveries, and order pressure in the same screen.

Drill-down path

Where to look next

Every card can lead back to the job, line, spool, report, or alert record behind it.

The moment

The daily meeting should not start with detective work.

In many filament plants, the day opens with detective work — status is scattered across screens, binders, and people until someone assembles it by hand.

Before Detective work

  • Which line is running, which job slipped, and how many spools passed QC overnight are reconstructed by hand.
  • Whether an urgent order is still safe depends on who you ask.
  • Nobody is sure who already checked the exception, so it gets checked twice — or not at all.

With acqSYS What changes

  • Active work, line state, spool counts, QC split, process drift, alert pressure, OEE, and delivery urgency are visible together.
  • Preparation, paused, idle, running, and maintenance contexts are separate, so setup time is not hidden inside production time.
  • Managers open the connected job, line monitor, spool, report, or alert instead of asking each team to rebuild context.
01 — Workflow

Run the floor in five-minute checks, not status meetings.

The page is designed for short, repeated checks: decide where attention is needed, open the right evidence, and leave the follow-up in the production or process record.
  • Read the floor. Start with live line state, active jobs, recent spool output, quality distribution, and process signals worth review by a technologist or the AI Process Advisor (beta).
  • Spot pressure. Review urgent deliveries, idle lines, job overruns, and open alerts without switching systems.
  • Open evidence. Drill into the connected job, line monitor, spool detail, report, or alert center.
  • Close the loop. Use alerts, job comments, reports, and fulfillment confirmation to keep the decision traceable.
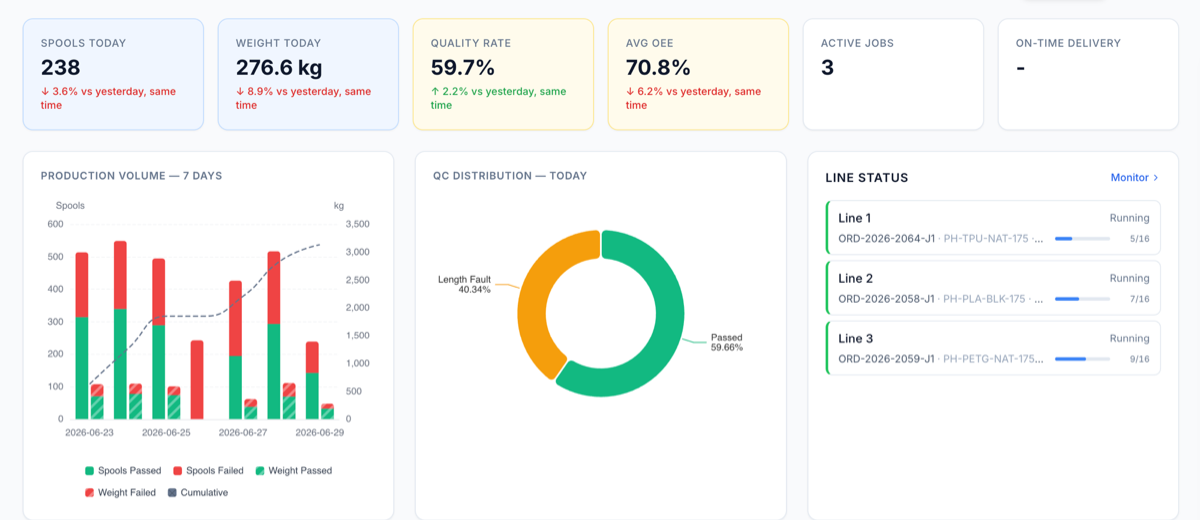
238 spools · 59.7% quality · 70.8% OEE
acqSYS dashboard headline: 238 spools today, 276.6 kg, 59.7% quality rate, 70.8% average OEE, the seven-day production-volume chart, and today's QC distribution.
02 — The daily floor picture

See every line, job, and at-risk order before the first walkaround.

The command center is not a presentation layer over spreadsheets. It reflects production execution, QC, alerts, planning, and fulfillment as the work happens.
  • Signals that matter. Spools produced today and recent QC split; average OEE and line status by context; upcoming deliveries and open production risks.
  • Who acts on it. Owner or general manager for escalation; production manager for daily control; supervisor for line-by-line follow-up.
  • What it prevents. Meetings that only reconstruct status; late discovery of idle lines or failing jobs; conflicting spreadsheet views of the same floor.
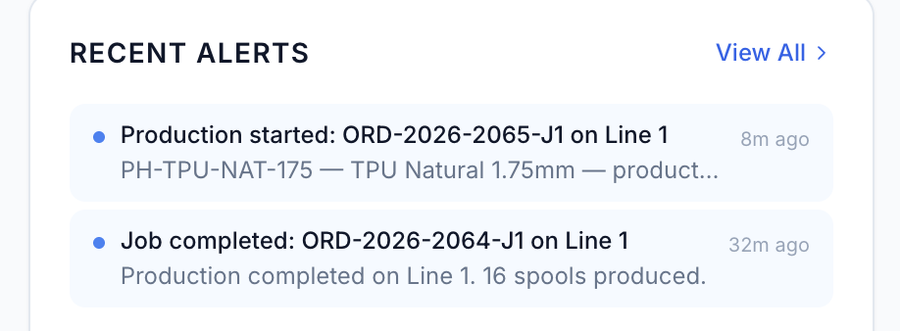
Time-stamped · production events
Recent alerts on the command center: production started and jobs completed across Line 1 and Line 3, time-stamped.
Scope & advantage

A floor picture built from production records, not status reports.

Honest scope Configuration still matters.

  • The command center becomes meaningful when lines, shifts, jobs, QC schemes, alerts, telemetry, and fulfillment policies are configured for the plant.
  • acqSYS should not pretend to know a line state that has not been connected or recorded.

acqSYS advantage Every number traces to a spool, a job, or an operator action.

  • The view is built from the filament loop: ProductHub, order, job, line, operator, spool, QC, label, fulfillment, and report all describe the same physical work.
Connected features

Every number on the dashboard opens into a connected record.

See Production command center in action

See what your daily production meeting could start from.

Bring your lines, shifts, order flow, QC pain points, and delivery risks. We will map the command center to the way your factory actually runs — and to the review habits that improve it.