Features / Run the line & cut scrap

01 Real-time line monitoring

Tie every temperature, speed, and diameter reading to the spool it belongs to.

acqSYS connects live values to the job, the product definition (ProductHub), process targets, QC window, and spool record — visible while the line is still running, reviewable after the spool is measured. This is the layer supervisors and technologists watch; operators run the floor from their own dashboard.

Use the demo to move from a line card into the telemetry and QC window behind a spool.
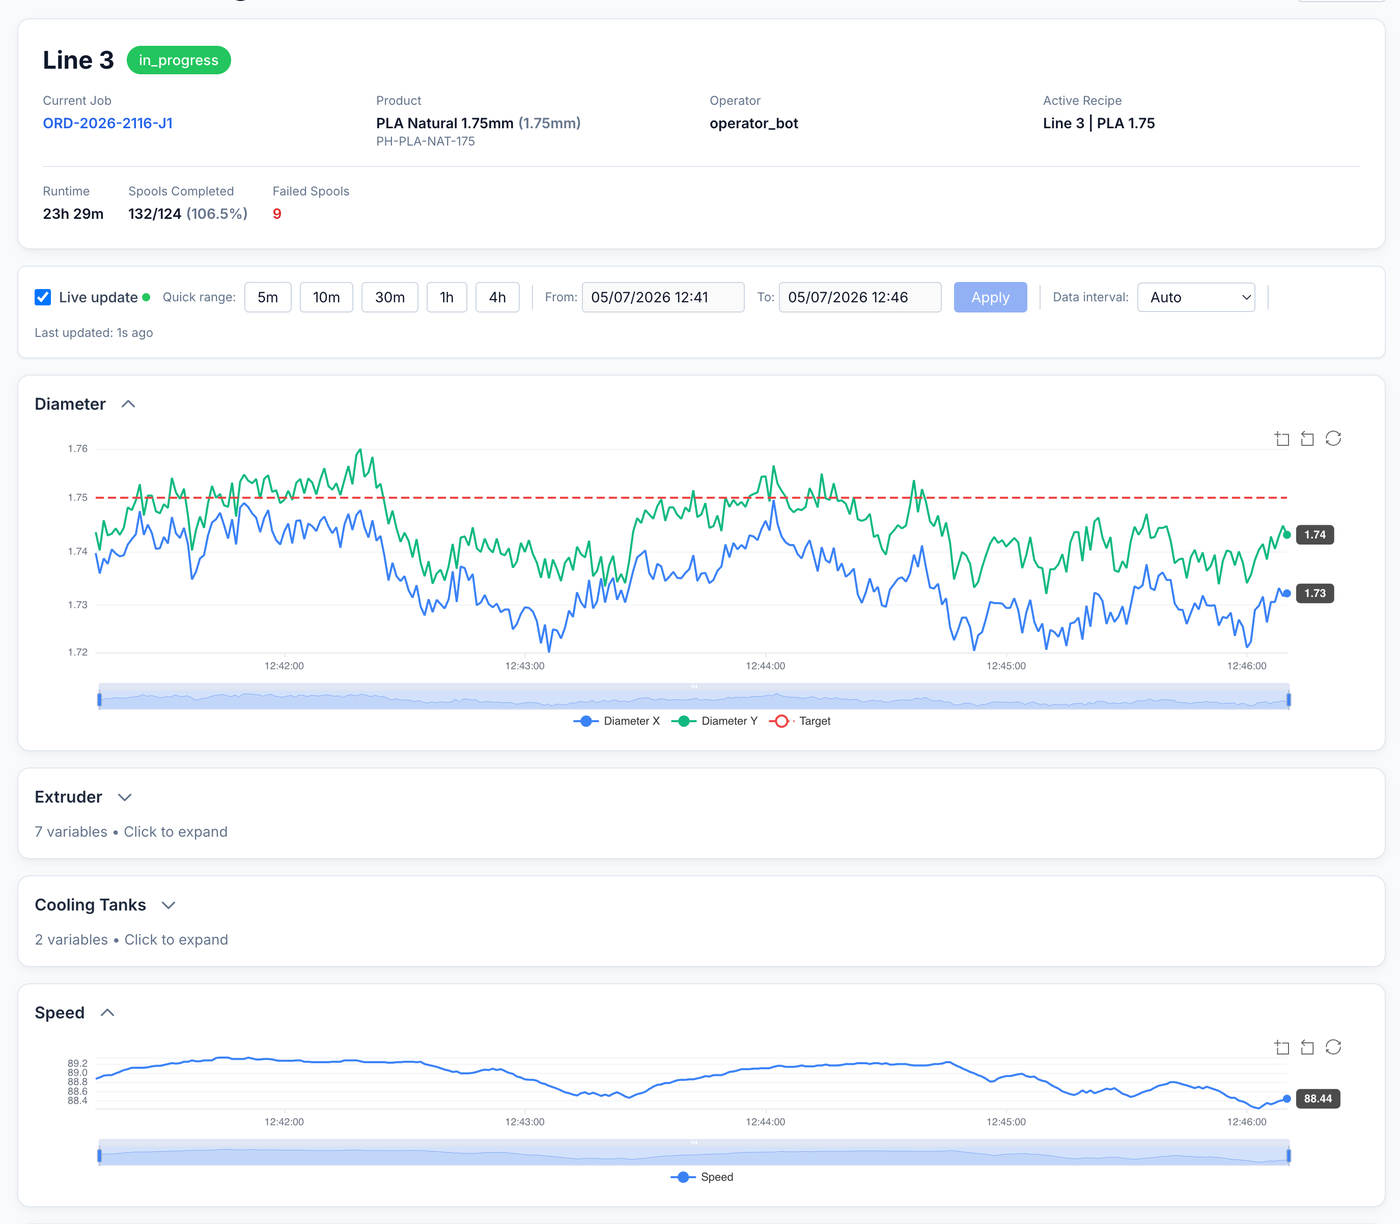
The real-time line monitor for Line 3: job header, live controls, and Diameter X and Y plotted against the 1.75 mm target.
132/124 spools · 106.5%
Line 3 in progress — PLA Natural 1.75 mm, runtime 23 h 29 m, 132 of 124 planned spools (106.5%).
Primary user

Supervisor + technologist

The people who need to see deviation before the spool is finished.

What it needs

Runs on your mapped signals

Monitoring depends on reachable data sources, supported protocols, mapped variables, and agreed process targets.

Best first signal

Speed + diameter

Start with the channels that influence QC decisions and spool interpretation.

What you get

Live signals arrive with job, line, and spool context already attached.

Three layers turn raw telemetry into evidence you can act on: line context, signal groups, and the bridge into QC.

01 — Who and where

Line context

Current job, operator, product, line state, progress, and downtime context.

02 — Live values

Signal groups

Diameter, speed, temperature, pressure, and other configured variables shown with meaning.

03 — Into quality

QC bridge

Mapped telemetry feeds spool detail, QC decisions, Cpk context, reports, and AI Process Advisor (beta) review.

The moment

A chart is not useful until it knows which spool it belongs to.

Extrusion teams can often see machine values somewhere, but the hard part is connecting a temperature, pressure, speed, or diameter change to the job, formulation, tolerance, line state, and finished spool outcome.

ORD-2026-2064-J1 · 10/16
Line 1 in progress — job ORD-2026-2064-J1, TPU Natural 1.75 mm, operator_bot, recipe Line 1 | TPU 1.75, 10 of 16 spools complete.

Live line context with production meaning. The line monitor is strongest when it explains which process signal belongs to which job, product, QC window, and spool.

With acqSYS What changes

  • Telemetry appears beside job, ProductHub, operator, line-state, and process-setting context.
  • Chart groups and overlays show configured targets next to live values for mapped signals.
  • The same time window supports QC, spool detail, reports, alerts, and AI Process Advisor (beta) review.
01 — Workflow

See diameter drift while the spool is still on the line.

Monitoring is implemented as a production and process evidence chain, not a loose wall of charts.
  • Connect — Bring lines in over the supported protocols and map the variables worth using first.
  • Label — Group signals by line and production meaning so operators and supervisors know what they are seeing.
  • Compare — Show targets, latest values, historical ranges, and QC-relevant time windows together.
  • Reuse — Feed spool detail, QC, reports, alerts, and AI Process Advisor (beta) review from the same telemetry source.
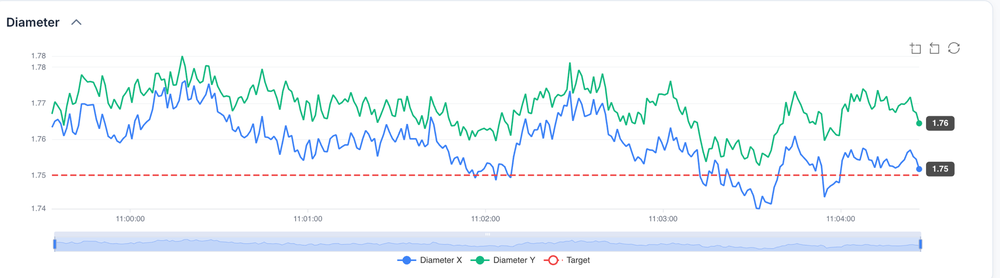
Live · X 1.75 · Y 1.76
Real-time line monitor: live Diameter X and Y plotted against the 1.75 mm target.
What is recorded

Evidence captured

  • Configured current values and time-series charts.
  • Line status, downtime, product, and operator context.
  • QC lookup windows and mapped gauge channels.
On the floor

Floor impact

  • Less guessing when diameter begins to drift.
  • Better supervisor-technologist conversations.
  • Cleaner escalation because everyone sees the same time window.
Getting started

Implementation levers

  • Supported protocols: OPC UA, Modbus TCP, MQTT, Beckhoff ADS, and EtherCAT.
  • Chart groups, field mappings, and target overlays are configured per deployment.
  • Missing live data is shown as missing.

Honest scope No invented telemetry.

acqSYS can show configured targets before every actual signal is wired, but it does not fabricate live machine data. Monitoring value grows as mappings are validated and process targets are agreed.

acqSYS advantage Every signal ends up in a spool record, not just a graph.

The monitor is tied to filament outcomes: diameter and speed context flows into spool QC, Cpk, OEE, reports, alerts, and AI Process Advisor (beta) evidence instead of living as an isolated graph.

Connected features

What the monitor sees, the record keeps.

Real-time line monitoring is one part of the connected production record — the same signals flow into quality, traceability, and process improvement.

See Real-time line monitoring in action

See which signals are worth connecting first.

We will review your lines, protocol options, gauge setup, process targets, and quality pain points — so monitoring starts where it pays.