Features / Plan & optimize

05 Reports & analytics

Explain production and process performance without rebuilding the spreadsheet.

acqSYS provides live production, line, operator, and product reports so managers and technologists review output, OEE, quality, downtime, and product and process behavior from the same production record.

Use the demo to move from a production overview into line, operator, and product drivers.
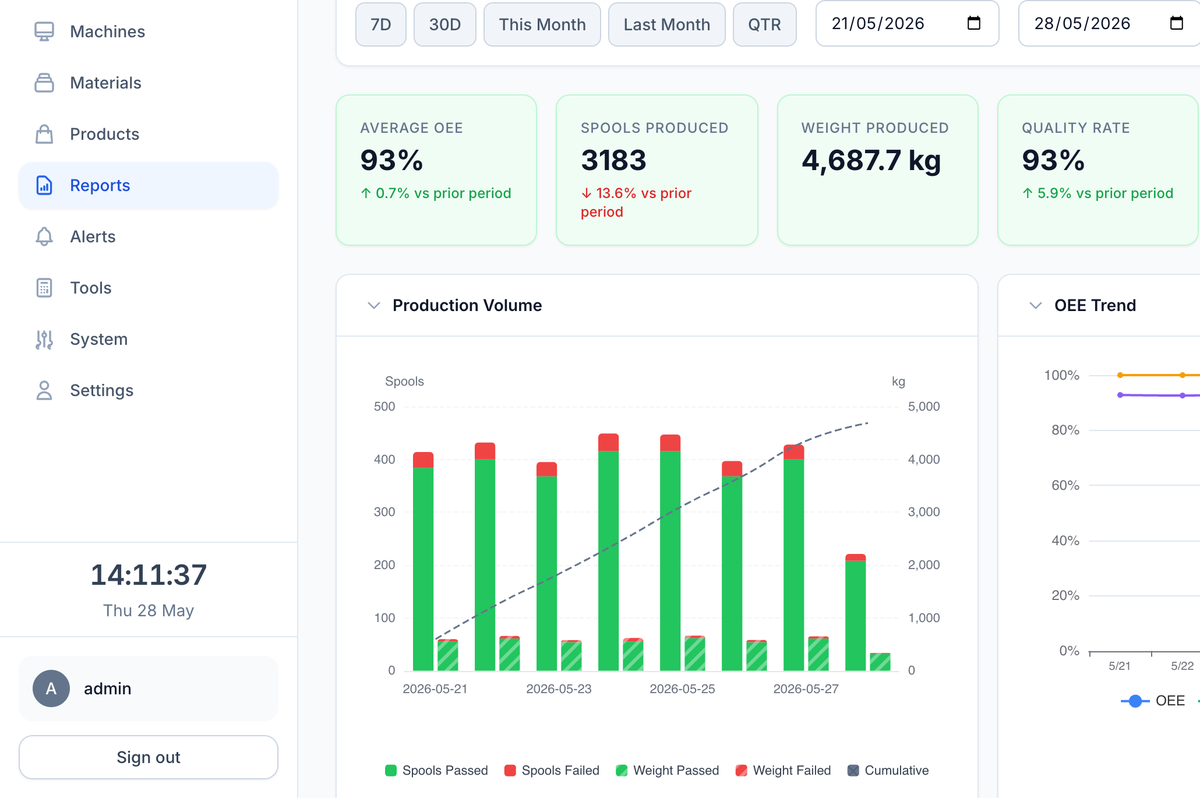
The production report: date presets, headline KPI tiles, and production volume and OEE trend charts.
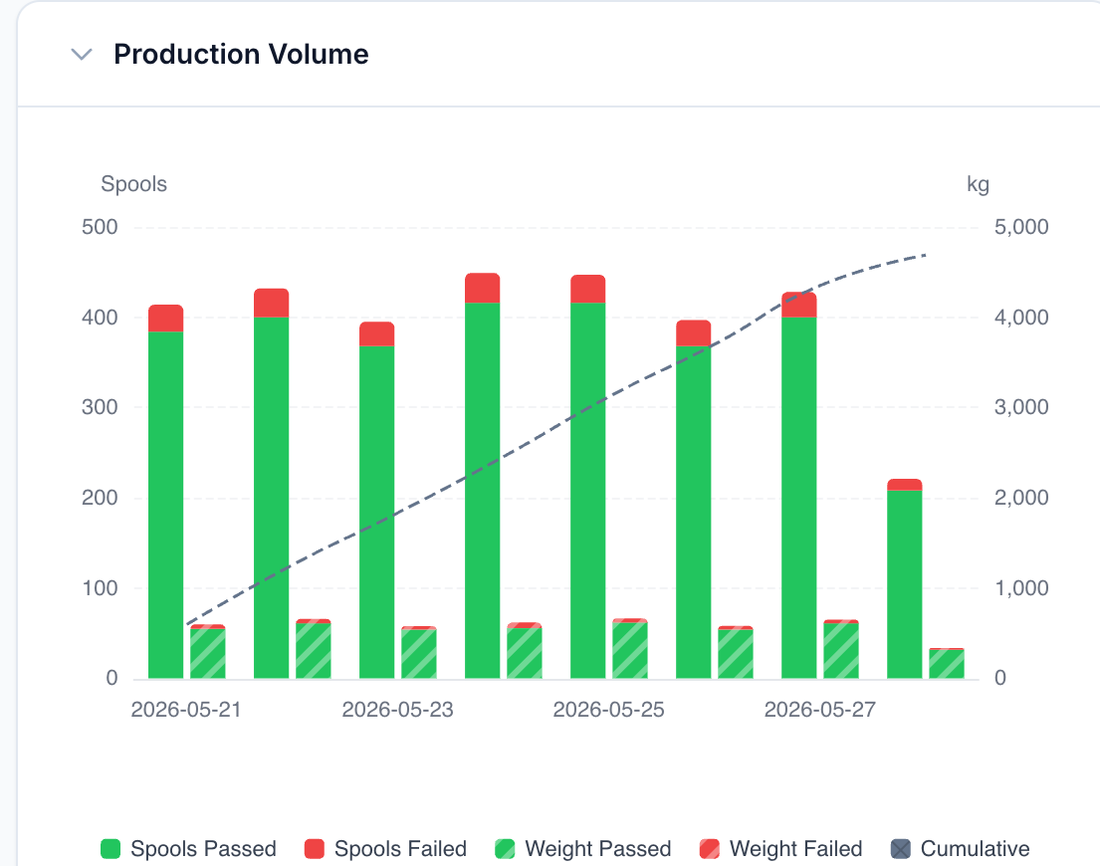
Spools · weight · cumulative
Production volume chart: daily passed and failed spools with weight and a cumulative trend line.
What you get

The weekly review runs on one set of numbers.

Production, line, operator, and product reports — live pages reading the same production record, from KPI down to spool.

Primary user

Leadership + supervisors + technologists

The team turning production and process records into decisions and follow-up.

Report mode

Live browser pages

Every report reads the current record — no stale exports circulating after the numbers move.

Best demo

Driver review

Take one weak KPI and drill into line, operator, product, or downtime context.

Production overview

High-level picture

Volume, OEE trend, QC distribution, downtime, and high-level throughput context.

Line and operator

Resource and people

Line utilization, prep time, and reliability; operator activity and consistency as coaching context.

Product report

SKU and ProductHub

SKU and ProductHub views for Cpk, diameter compliance, material lots, and configuration impact.

The moment

Reports should answer why, not only whether a number moved.

When every metric lives in its own file, the weekly review starts with reconciliation — management and engineering arguing about whose numbers are right instead of deciding what to improve.

Before The moment

  • Output, downtime, QC, OEE, product quality, process stability, and operator activity are exported separately.
  • Each export carries its own date ranges and definitions, so the numbers never quite agree.
  • By the time the numbers reconcile, there is little time left to act on them.

With acqSYS What changes

  • Production overview, line, operator, and product reports read from the same production evidence.
  • OEE, QC, downtime, utilization, throughput, weight, product behavior, and process stability are reviewed together.
  • Product reporting switches between commercial SKU and manufacturing ProductHub perspectives.
01 — Workflow

One definition of every KPI, four lenses on it.

Different operating and engineering questions need different lenses, but they should not require different definitions.

  • Overview. Review volume, OEE trend, QC split, downtime, and total production picture.
  • Line. Compare utilization, reliability, prep time, changeover, quality, and throughput by resource.
  • Operator. Review productivity, consistency, peer context, and intervention history.
  • Product. Explain quality behavior through SKU, ProductHub, Cpk, material lot, and configuration context.
02 — Reports from the same record

Stop rebuilding the weekly KPI pack from five exports.

The report is not a hand-built spreadsheet. It is aggregated from production, process, QC, downtime, operator, product, and weight evidence.
  • Metrics combined. Output, produced weight, OEE, quality, downtime, and utilization; line, operator, product, and job dimensions; date ranges with utilization interpreted consistently.
  • Decisions supported. Which line needs attention first; whether the driver is product, person, resource, or downtime mix; which ProductHub or SKU deserves review by a technologist or the AI Process Advisor (beta); and whether a process or formulation change actually held.
  • Review habits improved. Less manual report assembly; more consistent weekly definitions; a clearer path from KPI movement to production evidence.
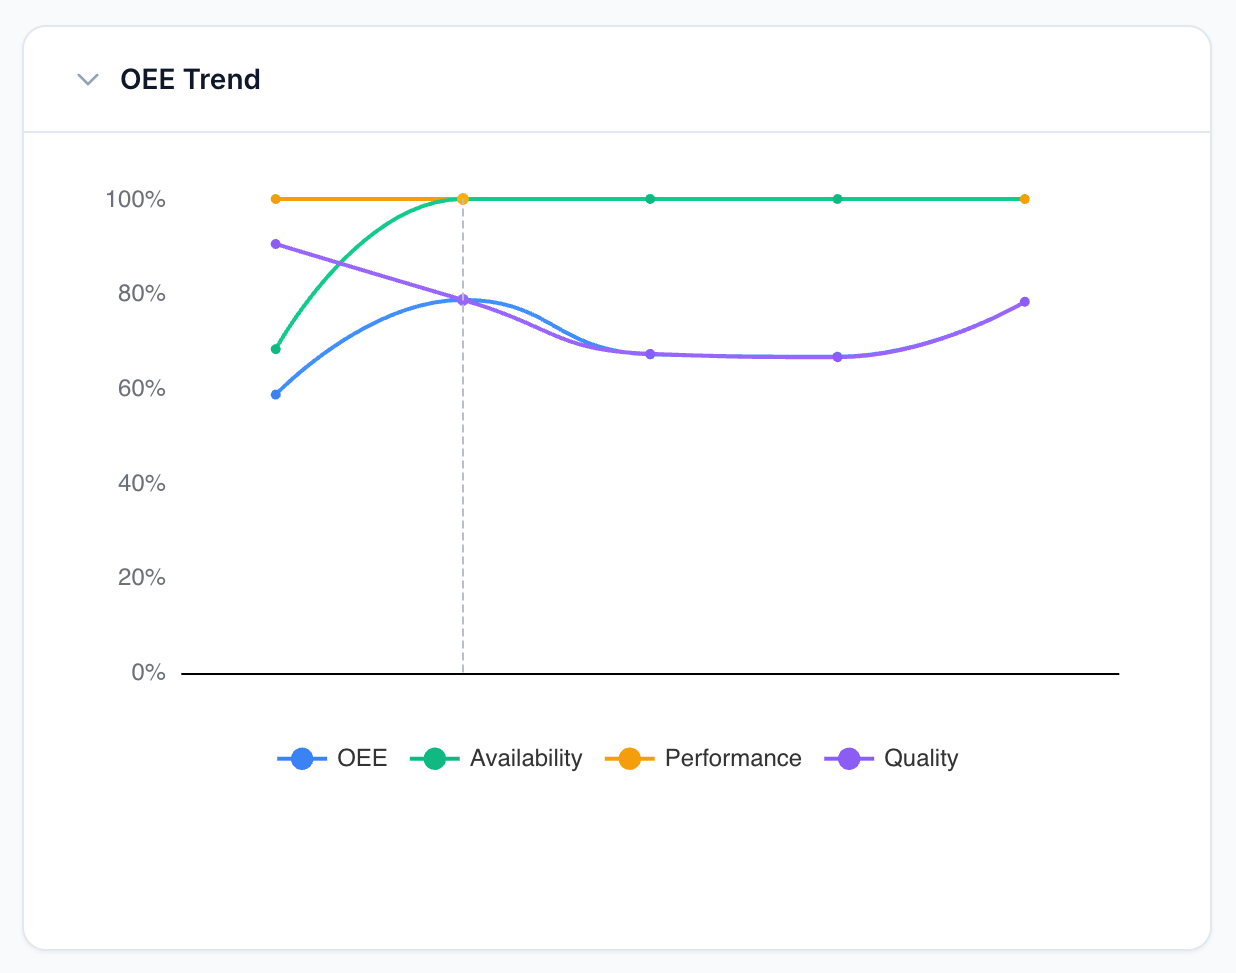
OEE · availability · quality
OEE trend chart tracking OEE, availability, performance, and quality across a production week.
Scope & advantage

Reports that drill from any KPI down to the spool behind it.

Honest scope Reports inherit the quality of operating data.

  • A report cannot rescue missing job, spool, QC, downtime, or product context. The value comes from running production through the connected acqSYS workflow.

acqSYS advantage Every lens drills to the spool and QC evidence behind it.

  • Reports connect to ProductHub, SKU, line, operator, production job, spool, QC, downtime, OEE, material context, and fulfillment rather than reporting one module at a time.
  • The same connected evidence gives engineering a basis to compare formulation and setpoint changes, cut scrap, and develop new grades with data instead of anecdote.
Connected features

Every report reads the same record the floor writes.

See Reports & analytics in action

Map your KPI pack to production evidence.

Bring your current production, quality, OEE, downtime, and operator reports — we will rebuild them from acqSYS evidence in front of you.